Logging and Monitoring
On this page
Your app is running in production. Users are hitting it. How do you know if things are working? If something breaks at 3 AM, how do you figure out what happened?
You can’t SSH into production and add console.log. You need logging, monitoring, and observability built in from day one.
Logging, What Happened
Logs are timestamped records of events. They tell you the story of what your application did.
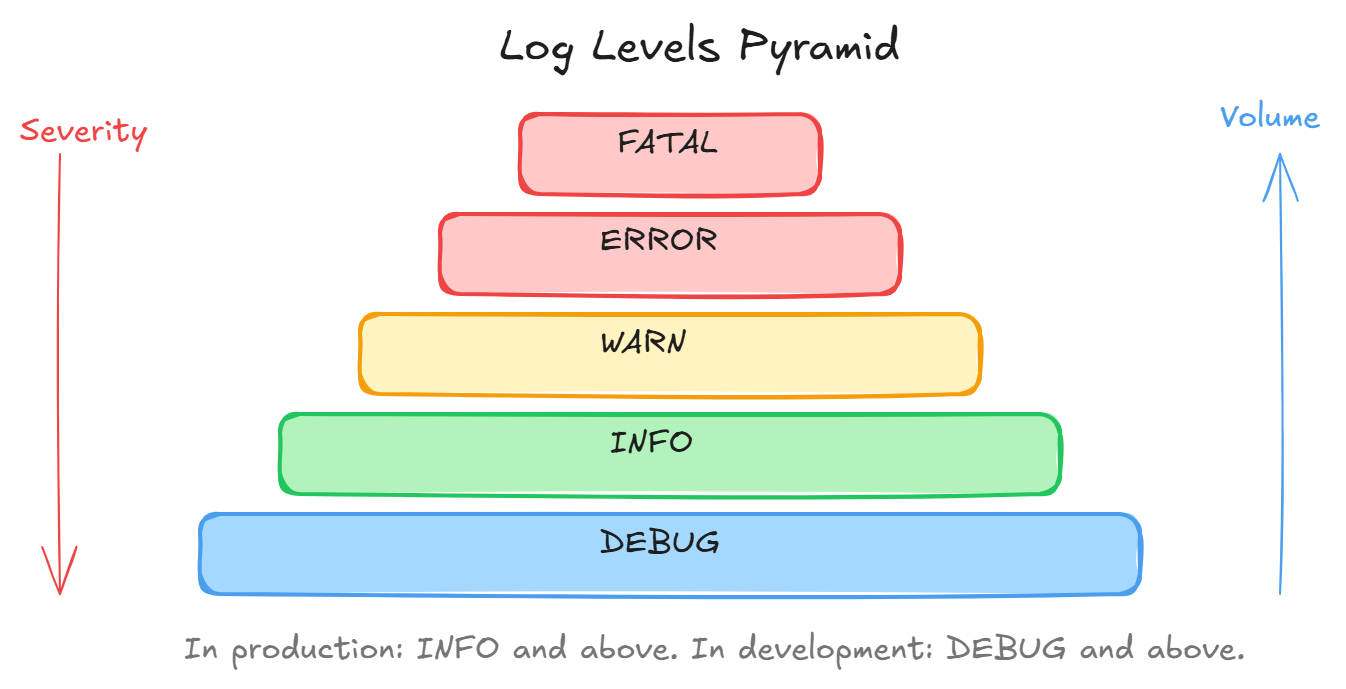
Log levels (from least to most severe):
- DEBUG, detailed dev info, disabled in prod
- INFO, normal operations (“server started”, “user logged in”)
- WARN, something suspicious but not broken (“disk 80% full”)
- ERROR, something failed (“database query failed”)
- FATAL, app is crashing (“out of memory”)
Structured logging is key. Don’t log plain strings. Log JSON:
{
  "level": "error",
  "message": "payment failed",
  "userId": 42,
  "orderId": "ord_abc",
  "error": "timeout after 5000ms",
  "timestamp": "2024-01-15T10:30:00Z",
  "requestId": "req_xyz"
}
This lets you search and filter logs programmatically. “Show me all errors for user 42 in the last hour.”
Monitoring, How Is It Doing Right Now
Monitoring tracks metrics over time and alerts you when things go wrong.
Key metrics to track:
- Request rate (requests/second)
- Error rate (% of requests returning 5xx)
- Latency (p50, p95, p99 response times)
- CPU and memory usage
- Database connection pool usage
- Queue depth (how many jobs are waiting)
Alerting rules:
- Error rate > 5%: page someone
- p99 latency > 2 seconds: warning
- CPU > 90% for 5 minutes: scale up
Tools: Prometheus + Grafana, Datadog, New Relic, CloudWatch.
Observability, Understanding WHY
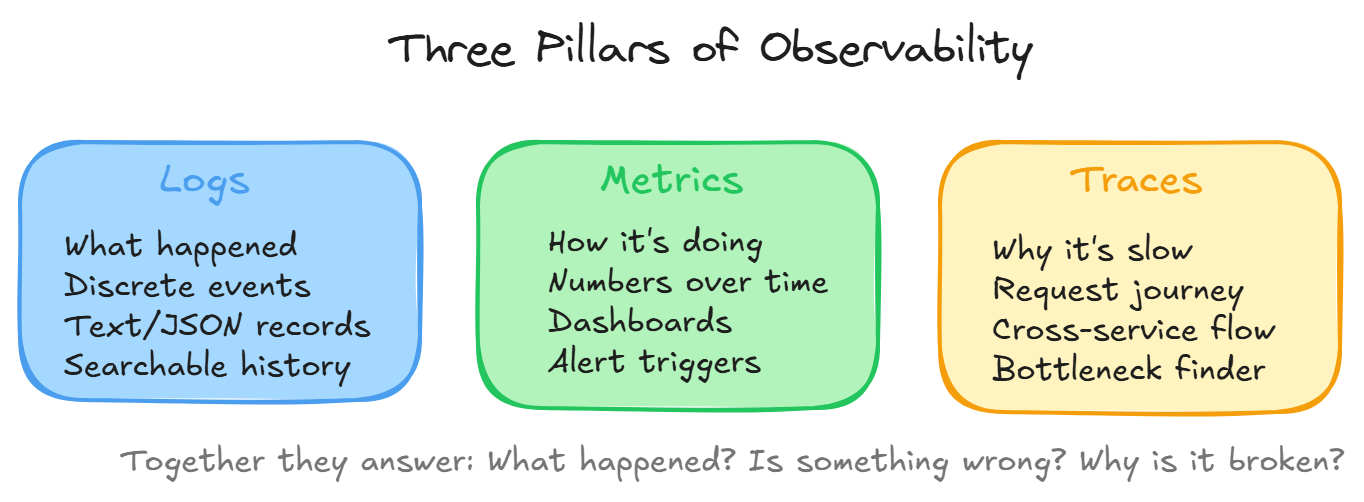
Logging tells you WHAT happened. Monitoring tells you IF something is wrong. Observability tells you WHY.
The three pillars:
- Logs, discrete events
- Metrics, aggregated numbers over time
- Traces, following a request through multiple services
Distributed tracing is crucial in microservices. A single user request might hit 5 different services. Tracing follows it through all of them:
User request → API Gateway (12ms) → User Service (8ms) → Database (45ms)
                                   → Notification Service (200ms) ← bottleneck!
Now you know exactly WHERE the slowness is.
Practical Tips
- Log at service boundaries (incoming request, outgoing response)
- Include request IDs in every log line
- Never log sensitive data (passwords, tokens, PII)
- Use structured JSON logs, not printf-style strings
- Set up alerts for error rates and latency, not individual errors
- Keep logs for 30-90 days (storage costs add up)
Wrapping Up
- Logging = what happened (events)
- Monitoring = how is it doing (metrics + alerts)
- Observability = why is it broken (traces)
- Use structured logs with request IDs
- Alert on error rates and latency thresholds
- Distributed tracing for microservices
Day 16 of 95 | Backend Engineering Series